This is a follow-up to my recent piece in the changes in the share of younger adults aged 25-34 with college degrees. A CNN story today has related info too.
I do think it’s important not to get carried away by this. First, looking at stats like percentage of a certain age group with degrees is only one way to slice the data. If you look at just pure metro area percentage growth in younger adults with degree, it’s mostly Sunbelt sprawltowns. The top five are: Riverside-San Bernardino, Las Vegas, San Antonio, Orlando, and Austin. San Francisco is ranked 33rd out of major metro area, though starting from a high base.
All of these dimensions: raw growth, percentage growth, and share growth tell us something about what is going on. We should take a broader look.
Going back to my previous share map, some people said they were surprised that Cincinnati and St. Louis looked so good. I went and looked at it in more detail, and it is in part an artifact of low denominator (total population) growth.
Cincinnati went from 30.5% of 25-34yos with degrees in 2000 to 39.0% in 2016, an 8.5 percentage point gain. Indianapolis went from 30.6% with degrees in 2000 to 37.4% in 2016, a gain of 6.9 percentage points. So Cincinnati appears to have outperformed Indianapolis.
But if you look at those other dimension, Indianapolis grew its total number of young adults with degrees by 40.5%. Cincinnati only grew by 31.4%. Indianapolis added 30,860 young people with degrees, which is more people with degrees than Cincinnati’s 26,744. It looks like Indianapolis attracted a lot more people without degrees than Cincinnati, which dragged its percentage down.
Again, both numbers matter. Indianapolis grew its higher skilled labor force in that age bracket by more than Cincinnati did, but Indy is going to have the feel of a slightly less educated place overall.
I also got in inquiry from Crain’s Chicago about county level data for that region. I pulled it, and it looked weird. Two of major mature suburban, decently upscale counties, DuPage and Lake, both lost younger adults with degrees. I asked asked Crain’s to sanity check this with demographer Rob Paral, and it’s apparently accurate. I put together the following chart of percentage growth in adults with degrees for various ages groups for those counties in the following chart:
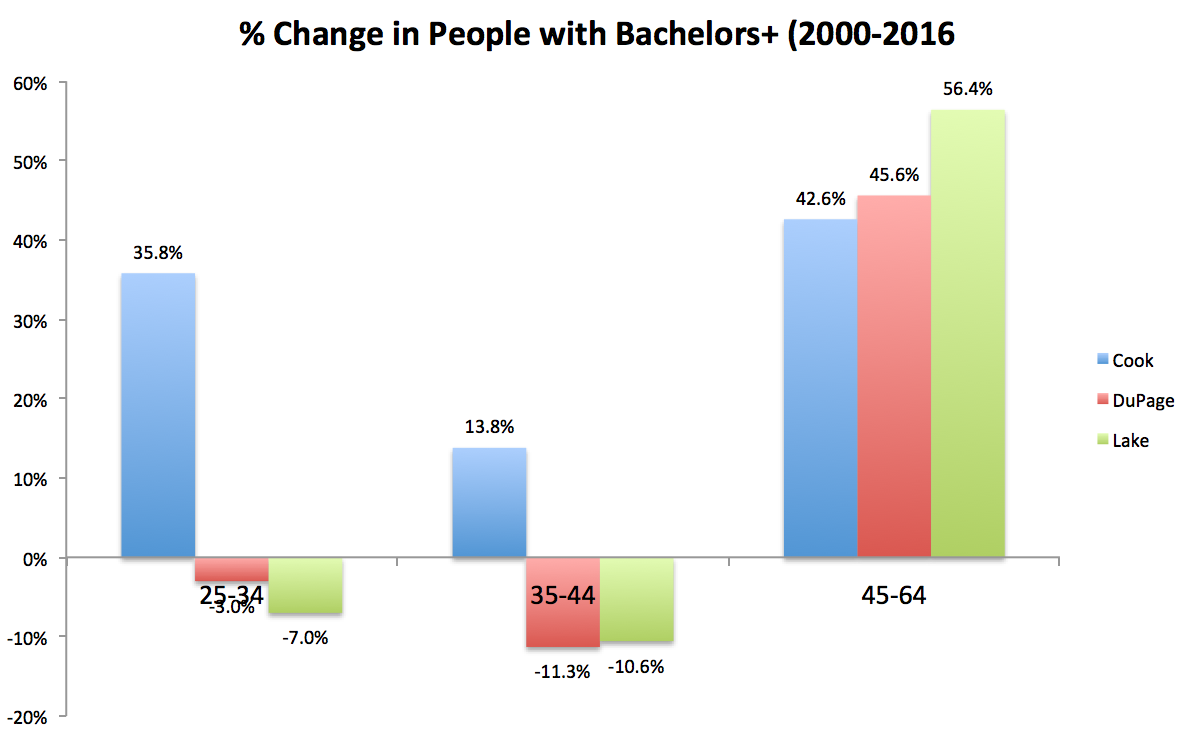
The high growth of adults with degrees all the way up to 44 is in Cook (Chicago). These younger brackets actually shrank in those suburban counties, which did well in the over 45s. There would appear to have been some significant aging in those suburbs, which could have implications for them in the future. There are a number of suburban and exurban counties I didn’t include. Many of them are growing younger people with degrees. But I found the case of these two large, mature suburban counties interesting.
from Aaron M. Renn
http://www.urbanophile.com/2017/10/24/more-on-younger-adults-with-college-degees/
No comments:
Post a Comment