The Census Bureau dropped its county and metropolitan area estimates this week. Here are a few points that jumped out at me.
- Austin, Texas was once again the fastest growing major metro, at 2.7%.
- Brooklyn (Kings County) is losing population, down by 2,088 people last year. This is a big reversal from earlier in the decade when Brooklyn was adding over 30,000 people per year. Growth levels also fell sharply in the other boroughs (apart from Staten Island). Not sure what is going on here, but it’s something to watch.
- The city of Philadelphia (same boundaries of city and county) continues to grow in population. It’s up by 52,592 since 2010, 3.4%.
- The independent cities of St. Louis and Baltimore both saw drops, drops that are much bigger in recent years than earlier in the decade. If this keeps up, St. Louis will soon drop below 300,000 in population – perhaps America’s most stunning population collapse.
- San Francisco continues to boom and is now headed towards 900,000 people. It’s currently at 884,363, up 9.8% since 2010.
- Columbus was the clear #1 growing major Midwest metro area, at 1.6% growth. Growth is accelerating in the region, and is up from only around 1% annual earlier in the decade. It ranked 13th last year in population growth. If this keeps up, Columbus will have a Sunbelt growth profile. It grew faster than Atlanta, Houston, Denver, and Salt Lake City. It only slightly trails Nashville in growth rate this point. Columbus may be the best positioned Midwest region to really pull away from the pack.
- Four major metros lost population: Pittsburgh, Chicago, Cleveland, and Rochester. Even Detroit is now growing again, albeit slightly.
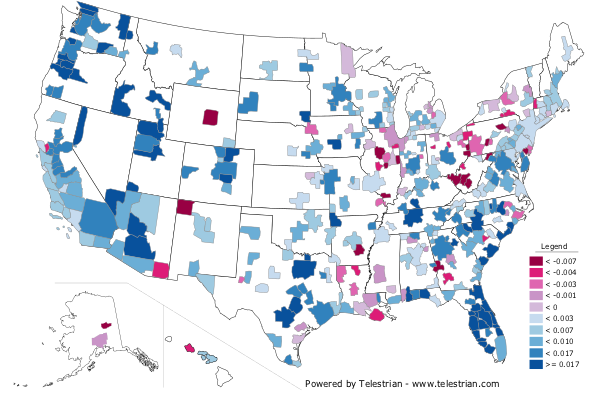
Here’s a map of metro area population growth and decline from 2016 to 2017:
Here are the top 10 fastest growing major metro areas.
| Rank | Metro Area | 2016 | 2017 | Total Change | Pct Change |
| 1 | Austin-Round Rock, TX | 2,060,558 | 2,115,827 | 55,269 | 2.68% |
| 2 | Raleigh, NC | 1,304,896 | 1,335,079 | 30,183 | 2.31% |
| 3 | Orlando-Kissimmee-Sanford, FL | 2,453,333 | 2,509,831 | 56,498 | 2.30% |
| 4 | Las Vegas-Henderson-Paradise, NV | 2,156,724 | 2,204,079 | 47,355 | 2.20% |
| 5 | Dallas-Fort Worth-Arlington, TX | 7,253,424 | 7,399,662 | 146,238 | 2.02% |
| 6 | Charlotte-Concord-Gastonia, NC-SC | 2,475,519 | 2,525,305 | 49,786 | 2.01% |
| 7 | San Antonio-New Braunfels, TX | 2,426,211 | 2,473,974 | 47,763 | 1.97% |
| 8 | Jacksonville, FL | 1,476,503 | 1,504,980 | 28,477 | 1.93% |
| 9 | Phoenix-Mesa-Scottsdale, AZ | 4,648,498 | 4,737,270 | 88,772 | 1.91% |
| 10 | Nashville-Davidson–Murfreesboro–Franklin, TN | 1,868,855 | 1,903,045 | 34,190 | 1.83% |
And here are the ten largest metro areas in the country.
| Rank | Metro Area | 2017 |
| 1 | New York-Newark-Jersey City, NY-NJ-PA | 20,320,876 |
| 2 | Los Angeles-Long Beach-Anaheim, CA | 13,353,907 |
| 3 | Chicago-Naperville-Elgin, IL-IN-WI | 9,533,040 |
| 4 | Dallas-Fort Worth-Arlington, TX | 7,399,662 |
| 5 | Houston-The Woodlands-Sugar Land, TX | 6,892,427 |
| 6 | Washington-Arlington-Alexandria, DC-VA-MD-WV | 6,216,589 |
| 7 | Miami-Fort Lauderdale-West Palm Beach, FL | 6,158,824 |
| 8 | Philadelphia-Camden-Wilmington, PA-NJ-DE-MD | 6,096,120 |
| 9 | Atlanta-Sandy Springs-Roswell, GA | 5,884,736 |
| 10 | Boston-Cambridge-Newton, MA-NH | 4,836,531 |
from Aaron M. Renn
http://www.urbanophile.com/2018/03/23/brooklyn-is-shrinking-and-other-population-notes/
No comments:
Post a Comment