The Census Bureau released its 2016 county level population estimates earlier this year. This gave us a window into the places that are gaining or losing total population.
Here’s a map of all the counties that have lost population since 2010.
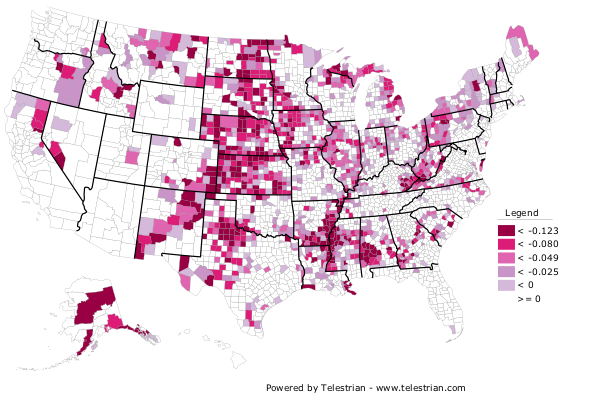
The numbers in the legend are the percentage change in population (multiply by 100).
But just last week the Census Bureau released the population estimates by age, sex, and race. I popped the age estimates into my database and mapped the counties whose child population (those under 18) is in decline. This is the demographic future of these communities apart from migration. Here’s that map:
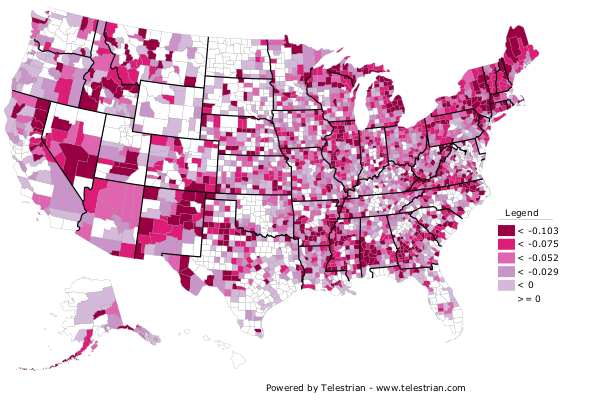
Yikes!
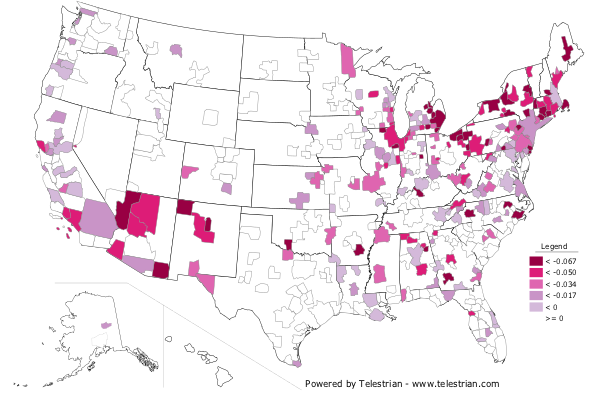
I also rolled this up to to the metro area level – and there are even a number of major metropolitan areas in the US – 25 out of 53 – with a declining population under the age of 18.
This is a very quick preliminary view for the blog. I’d definitely go dig into these numbers yourself before taking them to the bank. But this doesn’t look good for much of the country.
from Aaron M. Renn
http://www.urbanophile.com/2017/06/26/shrinking-america/
No comments:
Post a Comment